Hi, all. I’m trying to run my model through tfjs with webgl backend. But I do not know how to get the time cost of model prediction. I did call new Date.now() before and after model.predict() and got a result around 100ms, it’s good enough. But between predict and my actural output with tensor.array(), I got A UI block around 700ms. Dose that mean it did not finish prediction in 100ms and need the following 700ms?
As tf doc say:
When an operation is called, like tf.matMul(a, b), the resulting tf.Tensor is synchronously returned, however the computation of the matrix multiplication may not actually be ready yet. This means the tf.Tensor returned is just a handle to the computation. When you call x.data() or x.array() , the values will resolve when the computation has actually completed.
It sounds like general operations return synchronously before they actually done, so do model.predict()?
Another thing border me is that if model.predict acts like the other general operations, then why do that take 100ms to return a not done handle? 10ms predict with a handle return, and 700ms to run model before output with tensor.array() would be more reasonable.
Welcome to the forum and thanks for the question. Could you possibly share a live working version of your code on Glitch.com or Codepen.io for us to inspect? Thank you.
I have the answer. So model.predict() behind the scenes is actually executing all library JS code and WebGL commands but the result will come back only after all the GPU commands are done.
Thus to time how long this takes you should use a Date.now() right before you call model.predict() and then after model.predict() you should then call result.dataSync() to actually await for the result to come back. You can then use a 2nd Date.now() after that line to get the total time for result to return. So something like this:
let initialTime = Date.now();
let result = model.predict();
// Synchronously download data from Tensor.
// You could also use async call using just result.data() and use an await with that.
let data = result.dataSync();
let finalTime = Date.now();
let timeTaken = finalTime - initialTime;
You may need to move the execution onto a WebWorker to ensure the main GUI process is not blocked for the page itself whilst your model inference is performed. Assuming you have no way to make the model more optimal so that it takes less time to perform the inference then your other option would be WebWorkers. I have in the past managed to run TFJS models via a WebWorker and stream the results back via the API to the GUI thread to display results or such as you can see from this demo I made to emulate a webcam stream in Google Meet:
If you want to learn the basics check out these links as a start but there are probably others out there too for good tutorials:
The main thing here though is that to get any WebGL acceleration in WebWorker the browser needs to support OffscreenCanvas and you should use that as visual elements like regular canvas are not supported in WebWorker code as there is no visual output at that layer. Current state of OffscreenCanvas is shown here: OffscreenCanvas | Can I use... Support tables for HTML5, CSS3, etc
You can then send the results back to be shown in the GUI (regular web page code) however you wish with regular canvas etc as normal as you saw in my demo above.
I’ve checked my code, the predict/data tasks was executed on a WebWorker. But still, it blocked UI for 700ms. As a comparison, it got 800ms block when that tasks run on main thread.
In fact, even if I just call model.predict() without the following value.data(), it acted the same. Maybe i did not use WebWorker correctly.
I’m trying to upload a executable project, it will take some time. It’s something like this:
// index.js click to call worker from main thread
        tfWorker.postMessage({img: imgBuff}, [imgBuff]);
// get result from worker
        tfWorker.onmessage = function (e) {
            let featureBuff = e.data.featureBuff;
        };

// tfWork.js onmessage() get input data from main thread
    let imgBuff = e.data.img;
    let inputFloat = new Float32Array(imgBuff);
    let retBuff = await tfWrapper.processImg(inputFloat);
    postMessage({featureBuff: retBuff.buff}, [retBuff.buff]);

// tfjs/wrapper.tsx processImg() execute predict() and array() tasks
    tf.engine().startScope()
    tf.setBackend('webgl');
    let values = this.model.predict();
    let result = await values.array();
    tf.engine().endScope()
    return result;
Ah yes sorry you did have webworkers in your prior post. This is odd as AFAIK moving execution to a WebWorker will move that execution entirely to a different thread so it can not block the other main one running in browser dealing with GUI etc.
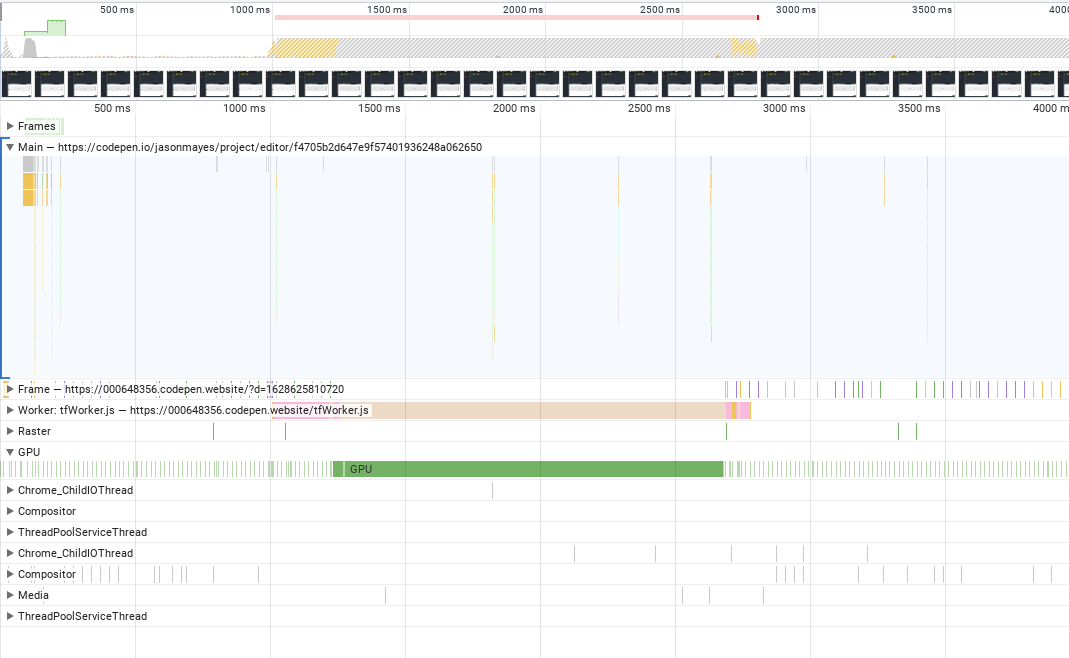
It makes me feel that some part of your code on the main thread is taking too long but from the snippets above it is not immediately obvious to me. You may want to use the Chrome Dev Tools to profile execution to see where most time is spent to check if any CPU execution is lagging things on the main thread:
You should be able to drill down into that performance capture what functions were the cause of the hanging at least. Worth a try!
Hello, Jason. I’ve upload my project to codepen, would you like to check it for me?
Because of my coworks aksed me not to release our model, I’ve replaced model.predict() with
        let testRand = tf.randomNormal([1024 * 1024 * 4]);
        let {values, indices} = tf.topk(testRand, 1024 * 1024);

        let valueArray = values.arraySync();
        let indArray = indices.arraySync();
It costed about 700ms on Xiaomi 8 (Android phone with Snapdragon 845 processor), and UI was blocked.
I see you are setting backend to WebGL here. Can you create a build that forces “wasm” instead? Unfortunately I can not modify or understand where TF library is located in your minified code to do that myself so may be easier for you to make version that forces CPU execution via web assembly.
Chrome uses GPU to render webpage DOM, so if this is taking up 100% of GPU resources then maybe that is what is causing the block as WebWorker is more about having different threads on CPU.
It works without any lag on GUI. Thus my thoughts that WebGL on webworker is not separate from main thread seems to be true. I therefore think for now you should compiler WASM backend into your custom build instead of WebGL and try that if you want true separate thread execution.
As for WebGL I shall discuss with our team what future options may be around this to reduce jank in browser when executing on WebGL backend. Thanks for bringing this to our attention.
Understood. When SIMD + Multithreading is default in browser you may find this changes - you can try it out under chrome://flags and enabling SIMD and restart browser to see what the future holds But yes for some models WebGL offers better execution in which case we shall have to see if we can figure out a way to limit GPU execution to allow GUI to update too as Chrome uses GPU to render DOM. Please keep track of the bug I started on Github above and add any further observations or other people who are having this issue to that thread so the engineering team can see.
Hi, Jason. I broke down my model into 4 submodels, then I tried to insert pause between models. It worked at first, I did break the 700ms UI block to several blocks like (100+200+300+200)ms.
But when I tried to make some smaller submodels, I found a conv2d layer cost more than 300ms on Snapdragon 845. Is that cost means something wrong or conv2d is a real monster?
I found a benchmark tool from tensorflow document: TensorFlow.js Model Benchmark .
From the test result, run that model just costs 15ms. I was so curious that I try to find out what happen on that profile function. It seems like the profile function just called model.predict() and did not get the result out with tensor.data() or tensor.array() function:


 But yes for some models WebGL offers better execution in which case we shall have to see if we can figure out a way to limit GPU execution to allow GUI to update too as Chrome uses GPU to render DOM. Please keep track of the bug I started on Github above and add any further observations or other people who are having this issue to that thread so the engineering team can see.