Hi,
I’m new to TensorFlow and have been trying to get a simple benchmark running to measure the predication latency for a model. My source code is as follows.
import time
import tensorflow as tf
from tensorflow import keras
from tensorflow.keras import layers

tf.config.optimizer.set_jit(True) # Enable XLA

def run(model, inputs, iters):
    total_time = 0
    for i in range(iters):
        start = time.perf_counter()
        model(*inputs, training=False)
        end = time.perf_counter()
        print(1000*(end - start))
        total_time += end - start
    return (1000 * total_time) / iters

batch_size = 32
head_size = 64
num_heads = 8
model_dim = 512
max_len = 512

inputs = layers.Input(shape=(max_len, model_dim))
outputs = layers.MultiHeadAttention(num_heads=num_heads, key_dim=head_size, value_dim=head_size, use_bias=False)(inputs, inputs)

model = keras.Model(inputs=inputs, outputs=outputs)

x = tf.random.uniform((batch_size, max_len, model_dim), minval=0, maxval=1)
run(model, [x], 100)
print(run(model, [x], 100))
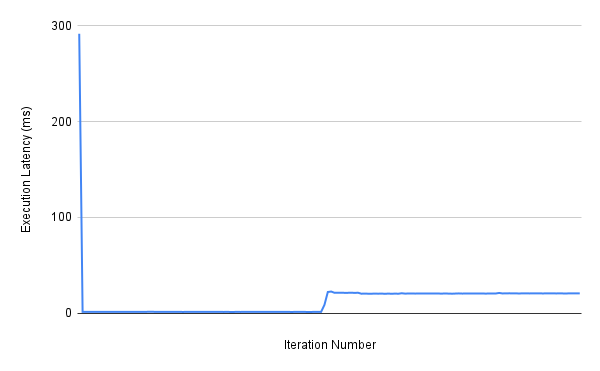
I observe that the execution latency is low for the first few iterations and then it rises to plateau at a different, but higher value (I’ve attached a plot of the execution time vs iterations below). I suspect this is due to memory management but I’m not sure. How do I go about performing such benchmarking correctly? My environment is as follows:
Software: TensorFlow 2.5.0, Python 3.8.10. I’m using a docker container running CUDA 11.
Hardware: GeForce GTX TitanX