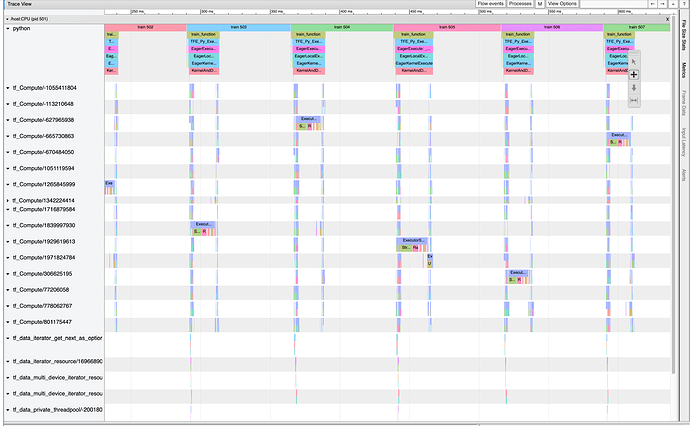
I posted this same question on Stackoverflow a few days ago, but got no answer. Maybe this more specialized forum has the knowhow to help me.
What I’m trying to understand is what is happening between EagerKernelExecute executions (the 4th or 5th block from the top). I’ve looked at the profiling docs a few times, but can’t figure out what that gap is.
How can I find where execution is spent? My goal is to parallelize the data prep/fetching while the model trains no-stop. Looking at htop during training, all 16 cores of my machine are mostly in hold-my-beer mode (10-20% usage, tops). There will be one or two cores that will spike (80%+) for a couple of seconds, then go back down for a few more seconds.
I’m using a CPU-only setup. 16 cores, 190GB memory, 8 TFRecords loaded with tf.Data following the posted best practices.
