Hi
I’ve written a custom function which takes 4 inputs and returns 2 outputs. In my application, both these outputs can be computed in parallel and I want to use static graphs in tf to automate this (code shown below).
@tf.function
def forward(X, dX, W1, W2):
    Z1 = tf.matmul(X, tf.transpose(W1))
    dZ1 = tf.matmul(dX, tf.transpose(W1))

    A1 = tf.tanh(Z1)
    dA1 = tf.multiply(tf.expand_dims(1-tf.square(Z1), axis=1), dZ1)

    Z2 = tf.matmul(A1, tf.transpose(W2))
    dZ2 = tf.matmul(dA1, tf.transpose(W2))
    return Z2, dZ2
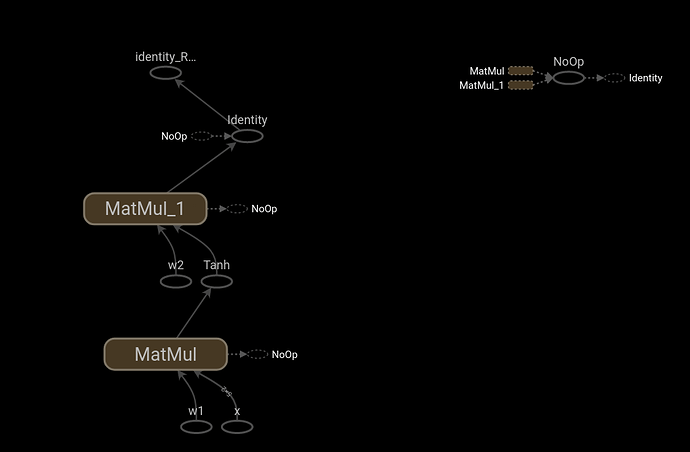
To make sure that the computations are done in parallel I wanted to visualise the graph. However when I launch tensorboard, it doesn’t show me computations corresponding to dZ2 (code used shown below).
%load_ext tensorboard
from datetime import datetime
from packaging import version

# Set up logging.
stamp = datetime.now().strftime("%Y%m%d-%H%M%S")
logdir = 'logs/func/%s' % stamp
writer = tf.summary.create_file_writer(logdir)

# Bracket the function call with
# tf.summary.trace_on() and tf.summary.trace_export().
tf.summary.trace_on(graph=True, profiler=True)
# Call only one tf.function when tracing.
Z2, dZ2 = forward(X, dX, W1, W2)
with writer.as_default():
  tf.summary.trace_export(
      name="my_func_trace",
      step=0,
      profiler_outdir=logdir)
%tensorboard --logdir logs/func
