I’ve been trying to visualize the graph of a tf.function with and without Grappler optimizations but so far I’m not managing to see any difference in the generated graphs.
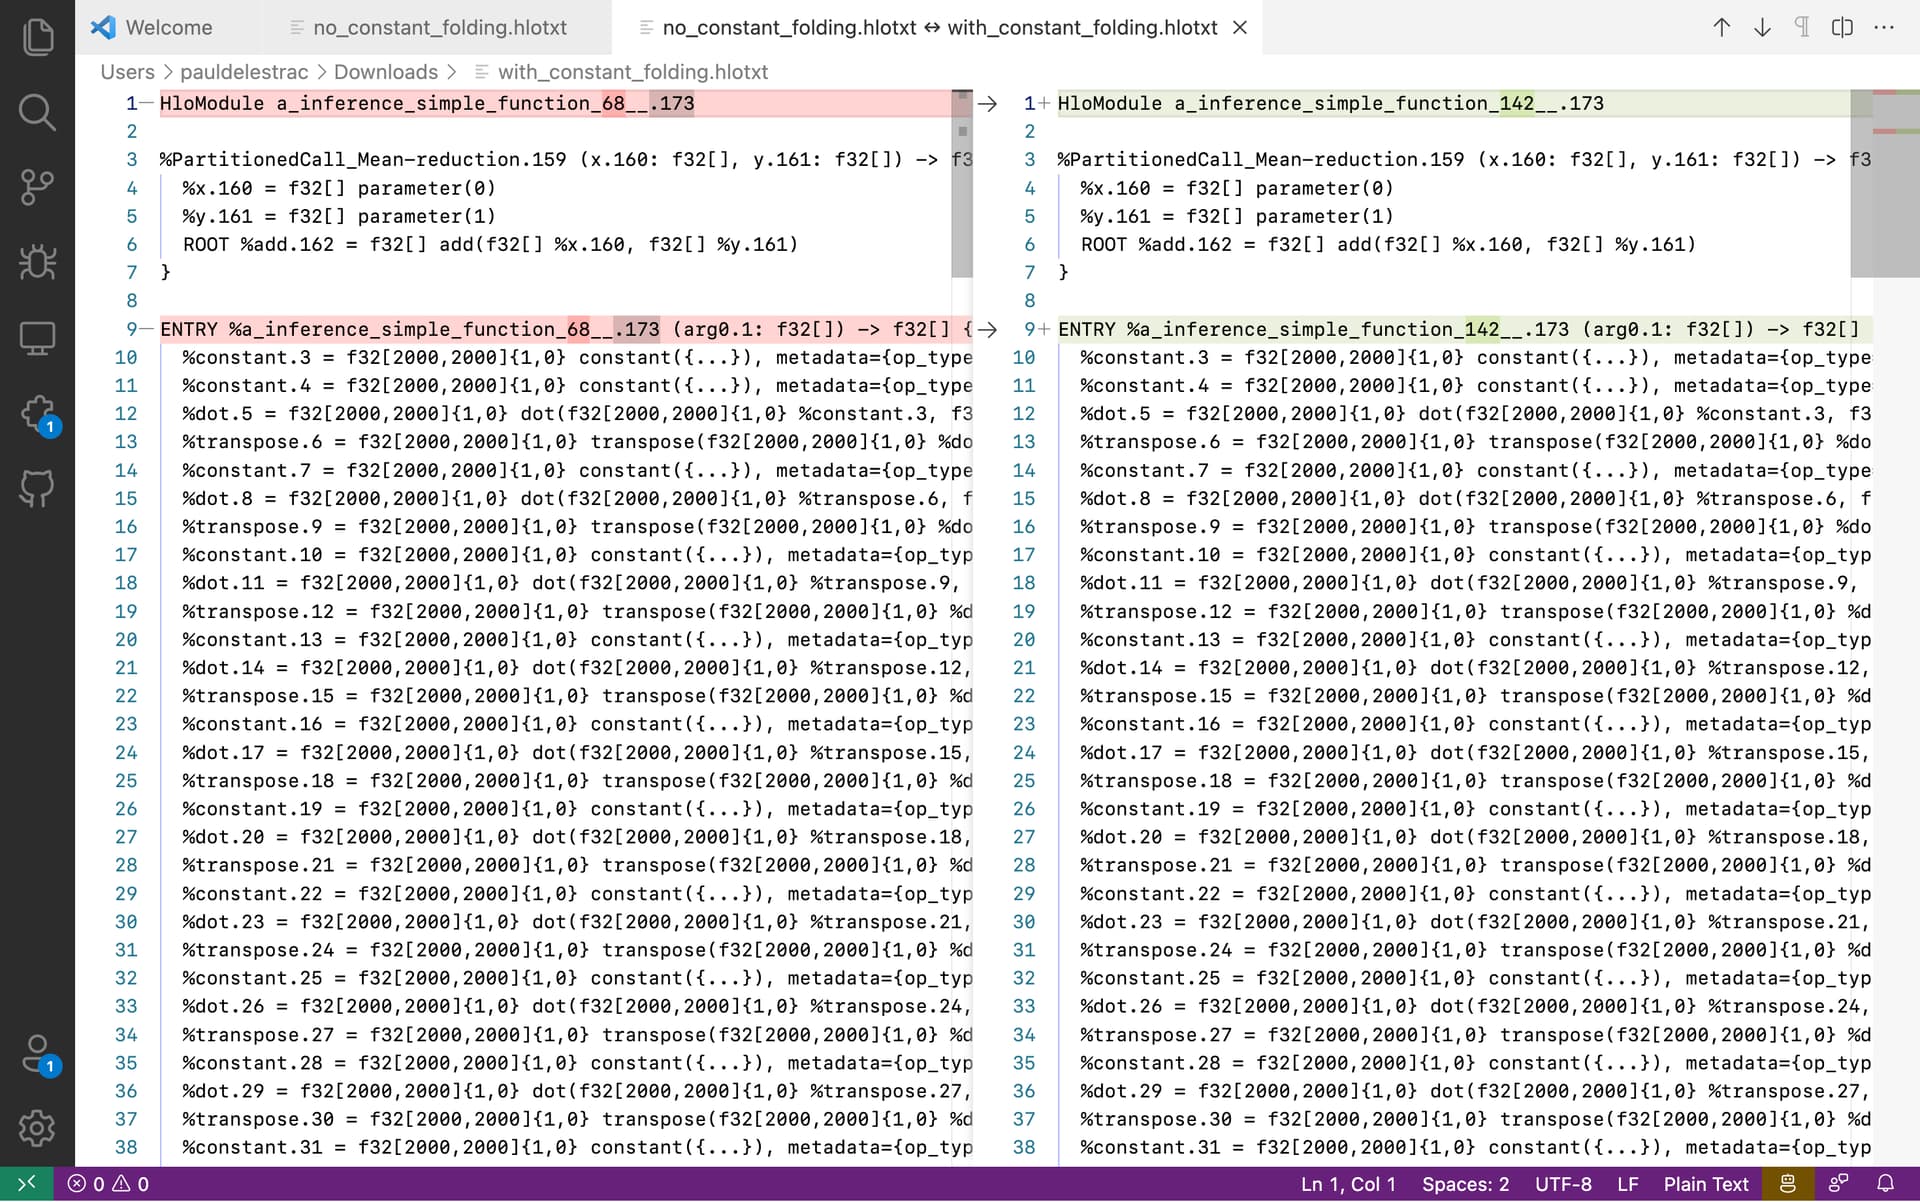
Here is the process I followed: I took the code used in the “TensorFlow graph optimization with Grappler” tutorial to visualize the graph with and without constant folding. Then, I use the experimental_get_compiler_ir function with the “hlo” setting to generate the graph before XLA optimizations: simple_function.experimental_get_compiler_ir(x)(stage="hlo"). Finally, I use the interactive_graphviz XLA tool to visualize the graphs. Unfortunately, I’m not able to see any difference between the generated graphs: in both cases constant folding has not been optimized.
When designing the mentioned process, I was assuming that Grappler optimizations are executed first and then XLA optimizations take over. However, I just found a recent post suggesting that the use of XLA could disable Grappler passes, which doesn’t make sense to me but it’s consistent with my observation.
Is there anything wrong in the process I’m following? If so, is there an alternative way to visualize graphs before and after Grappler passes?
Here is the code I used to generate the graphs:
import numpy as np
import timeit
import traceback
import contextlib

import tensorflow as tf

@contextlib.contextmanager
def options(options):
  old_opts = tf.config.optimizer.get_experimental_options()
  tf.config.optimizer.set_experimental_options(options)
  try:
    yield
  finally:
    tf.config.optimizer.set_experimental_options(old_opts)

def test_function_1():
    @tf.function(jit_compile=True)
    def simple_function(input_arg):
        print('Tracing!')
        a = tf.constant(np.random.randn(2000,2000), dtype = tf.float32)
        c = a
        for n in range(50):
            c = c@a
        return tf.reduce_mean(c+input_arg)
    return simple_function

with tf.device("/gpu:0"):
    with options({'constant_folding': False}):
        print(tf.config.optimizer.get_experimental_options())
        simple_function = test_function_1()
        # Trace once
        x = tf.constant(2.2)
        simple_function(x)
        for i in range(2):
            print("Vanilla execution:", timeit.timeit(lambda: simple_function(x), number = 1), "s")
        # with open("no_constant_folding_opt_hlo.pbtxt", "w") as f:
        #     f.write(str(simple_function.experimental_get_compiler_ir(x)(stage="hlo")))

    with options({'constant_folding': True}):
        print(tf.config.optimizer.get_experimental_options())
        simple_function = test_function_1()
        # Trace once
        x = tf.constant(2.2)
        simple_function(x)
        for i in range(2):
            print("Constant folded execution:", timeit.timeit(lambda: simple_function(x), number = 1), "s")
        # with open("with_constant_folding_opt_hlo.pbtxt", "w") as f:
        #     f.write(str(simple_function.experimental_get_compiler_ir(x)(stage="hlo")))