Consider the below nested functions with tf operations and the generated Op Graphs in the following cases:
-
If the inner function is decorated with
tf.function, it is displayed in the Graph only as genericStatefulPartitionedCall. -
If the inner function is not decorated, its operations are expanded and added to the Graph, however without any denoting for being part of a nested process.
Is there a way to display the nested function with its name and then be able to expand its operations when needed? Next I will try to add the functions to a Keras model in order to have a conceptual graph. However, I wonder what are the general possibilities of displaying nested functions with and without decorators and for different types of graphs. Some examples would be really helpful!
logdir = 'logs/func/' + datetime.now().strftime("%Y%m%d-%H%M%S")
writer = tf.summary.create_file_writer(logdir)
tf.random.set_seed(123)
nT = tf.constant(400)
n = tf.constant(100000)
dt = tf.constant(1/365)
drift = tf.constant(0.08)
sigma = tf.constant(0.1)
K = tf.constant(1.0)
@tf.function
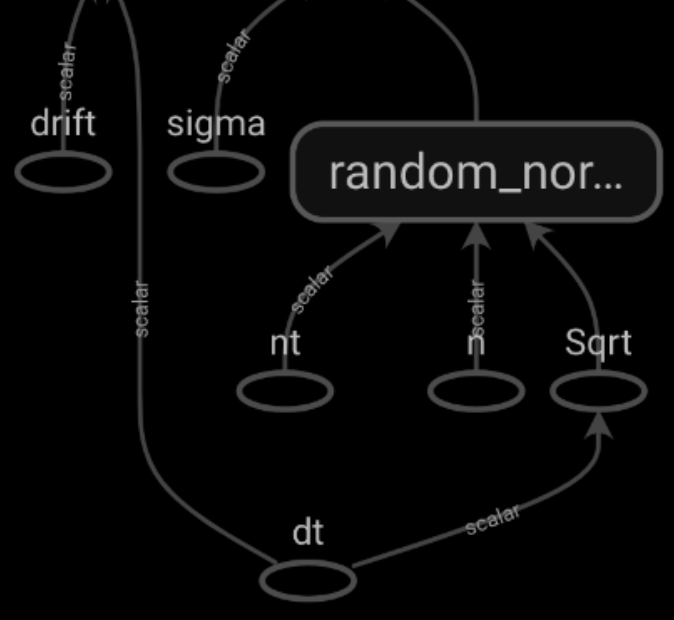
def brownian_motion(dt, nT, n):
dWt = tf.random.normal(mean=0, stddev=tf.math.sqrt(dt), shape=[nT, n])
return dWt
@tf.function
def option_mc(n, nT, dt, drift, sigma, K):
dWt = brownian_motion(dt, nT, n)
dYt = drift*dt + sigma*dWt
C = tf.cumsum(dYt, axis=0)
S = tf.exp(C)
A = tf.reduce_mean(S, axis=0)
P = tf.reduce_mean(tf.maximum(A - K, 0))
return P
tf.summary.trace_on(graph=True, profiler=True)
result = option_mc(n, nT, dt, drift, sigma, K)
with writer.as_default():
tf.summary.trace_export(
name='demo_trace',
step=0,
profiler_outdir=logdir)